Data-driven Product Segmentation
During my collaboration with a tire manufacturer, I identified a significant issue with production capacity being insufficient during peak times, challenging the maintenance of optimal production schedules. Therefore, my objective was to develop an effective, data-driven production prioritization method that adapts to changing capacity and demand.
Methodology:
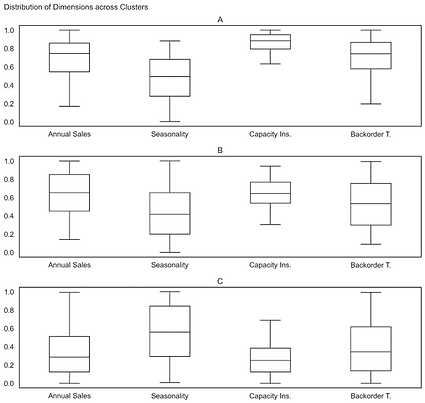
I analyzed product dimensions crucial for operations, such as annual sales and capacity insufficiency. After discovering significant data skewness, I moved from basic data transformation techniques to more advanced methods, ultimately selecting the Quantile Transformer. This approach, combined with the Analytic Hierarchy Process (AHP), effectively prioritized products based on their relative importance. I used the Analytic Hierarchy Process (AHP) to prioritize products based on four key dimensions: Annual Sales, Seasonality, Capacity Insufficiency, and Backorder Tendency. Company managers conducted pairwise comparisons of these dimensions, which were input into a matrix to calculate relative importance weights through matrix algebra. The resulting weights assigned were: Capacity Insufficiency at 48.5% (most important), Backorder Tendency at 29.4%, Annual Sales at 16.1%, and Seasonality at 6% (least important).
Comparative Analysis:
I benchmarked the Quantile Transformer against common transformation techniques to ensure it was the best fit for addressing the manufacturer's challenges, refining our ABC classification system to prioritize high-need products effectively.
Result:
This method provided a scalable and transparent solution for managing data anomalies and integrating new data points. It enhanced the inventory management strategy, helping the tire manufacturer better manage production schedules and reduce stockout risks during high-demand periods.
You can access the sample Python notebook code.
AHP, a measurement theory that derives priority scales from expert assessments, allowed me to determine the relative importance of different objectives effectively.
Saaty, T. L. (2003). Decision-making with the ahp: Why is the principal eigenvector necessary. European journal of operational research, 145(1):85–91.Saaty, T. L. et al. (2008). Decision making with the analytic hierarchy process.International journal of services sciences, 1(1):83–98.
transformation


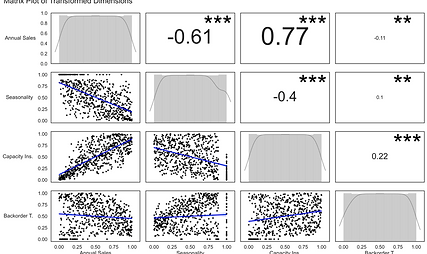
(A (*) indicates a p-value less than or equal to 0.05, representing a statistically significant correlation at the 95% confidence level. (**) suggest a p-value less than or equal to 0.01, indicating stronger evidence of correlation at the 99% confidence level. Lastly, (***) highlights a p-value less than or equal to 0.001, denoting very strong evidence of correlation, significant at the 99.9% confidence level.)
quantile vs. min-max
The figures compare the effects of different data transformation methods on product categorization. Quantile Transformation evenly distributes data across categories, indicating a balanced approach. In contrast, Min-Max normalization shows a right-skewed distribution with most scores clustered at lower values and outliers at higher scores, suggesting potential anomalies. This highlights the need to understand the mechanics of the chosen data transformation method to ensure accurate decision-making and interpretation. Despite similar scores, the Quantile Transformer is less affected by outliers compared to Min-Max normalization, making it a more robust choice for updating or introducing new data.


The plot provides a visual comparison between two data transformation methods, showing how they categorize products into 'A', 'B', or 'C' classes. The y-axis displays the product distribution based on the Quantile Transformation, with stacked bars indicating how these products would be categorized under Min-Max normalization.
For products initially labeled as 'A' by the Quantile Transformer:
-
68% retained the 'A' label with Min-Max normalization, showing alignment for most top-tier products.
-
32% were downgraded to 'B' by Min-Max, suggesting it is more conservative in assigning top-tier labels.
For 'B' category products:
-
60% retained their 'B' labels across both methods, indicating agreement on mid-tier products.
-
26% were downgraded to 'C', and 14% were upgraded to 'A' with Min-Max normalization.
For the 'C' category:
-
84% of products labeled 'C' by the Quantile Transformer remained in 'C' with Min-Max, showing a strong consensus for these products.

insights